Participants at Bring It events were asked to share three words to describe what influences their vote. The word cloud above weights their responses.
THE DATA IS IN
One of the toughest challenges for social impact projects is determining whether or not you’ve made a difference. While it’s easy to tally the number of times a film has streamed or the shares on Facebook, how do we measure shifts in attitude? Bring It to The Table set out to support civil discourse so people would be more willing—and able—to reach across the partisan divide. Our goal is to get people to examine their own biases and become the change they want to see in restoring civility. That’s a tall order for ‘the little project that could,’ which is why we are determined to find ways to make inroads.
Bring It to The Table partnered with A Fourth Act to develop a customized version of Harvis that would help us peek inside the partisan identities and assumptions held by people who attend our live interactive events. The app enables everyone in the audience to become a participant, while helping us gauge whether the project is having its desired impact.
The charts below reveal what we’ve found from a sample of roughly 1,000 participants across the country. The surveys were completely anonymous so people would be less inclined to temper their answers.
Questions we sought to answer:
How do you identify politically when you walk in the room?
What are your assumptions and biases about your party and the political ‘other’?
Can a deeper discussion about partisanship, using our Table Talk method as a guide, shift your thinking?
How well does your partisan identity align with your opinion about specific issues?
Premise of our project
The current political climate pits citizen against citizen and elevates party above country. We speculate that individuals’ beliefs are far more complex than a two-party system allows. We believe that between our film and live Table Talks, it is possible to break the cycle of demonizing the political ‘other’ in order to generate self-awareness, personal agency and common ground in reversing the current trend. To that end, we devised an Entry & Exit Poll.
Results
After asking participants to share their own political identities, we established a horizontal axis that captures the degree to which respondents align along the left/right spectrum. We then asked a series of questions designed to reveal the implicit biases we carry about people who align and don’t align with our party identity. These biases were measured before and after the presentation. Use the slider to swipe between the before and after on each data set.
What does this mean?
The charts all demonstrate a significant shift in attitude after a two-hour Bring It event. All four charts reveal a consolidation toward the center, implying that there was an overall modification in the group’s attitude away from the extreme edges. On every question, the group trends toward a more neutral stance at the end of the event, which implies that participants recognize that assumptions about one’s own party and the political ‘other’ might be exaggerated and there is greater potential to humanize the ‘other side’.
Recognizing personal biases can potentially create space for civil discourse. By acknowledging that the political ‘other’ isn’t as clueless or close-minded as you previously assumed, you are more likely to invite conversation and gain greater awareness of diverse perspectives. Civil discourse doesn’t assume a kumbaya moment where everyone agrees, but rather it allows us to disagree with respect.
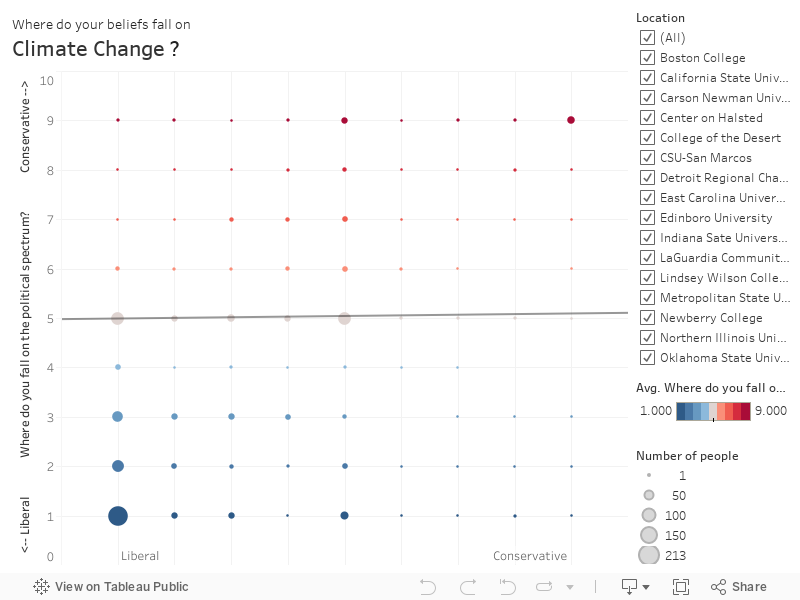
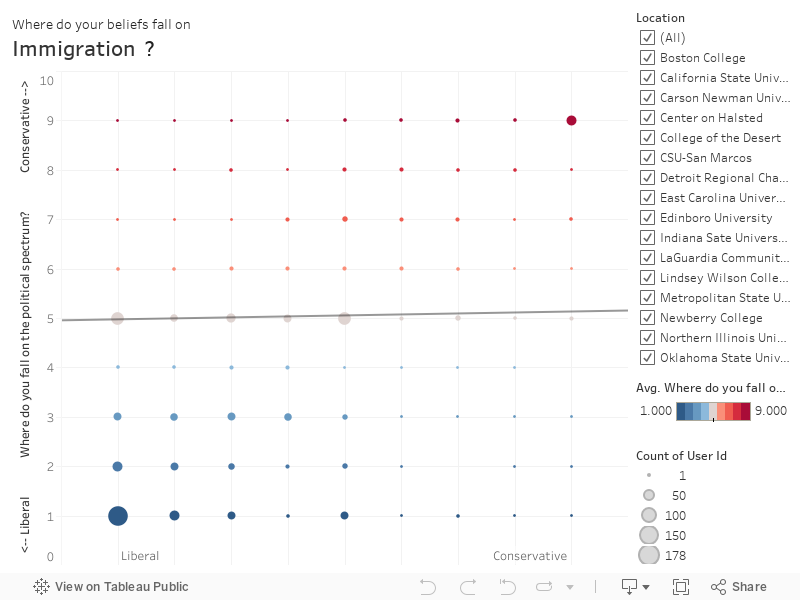
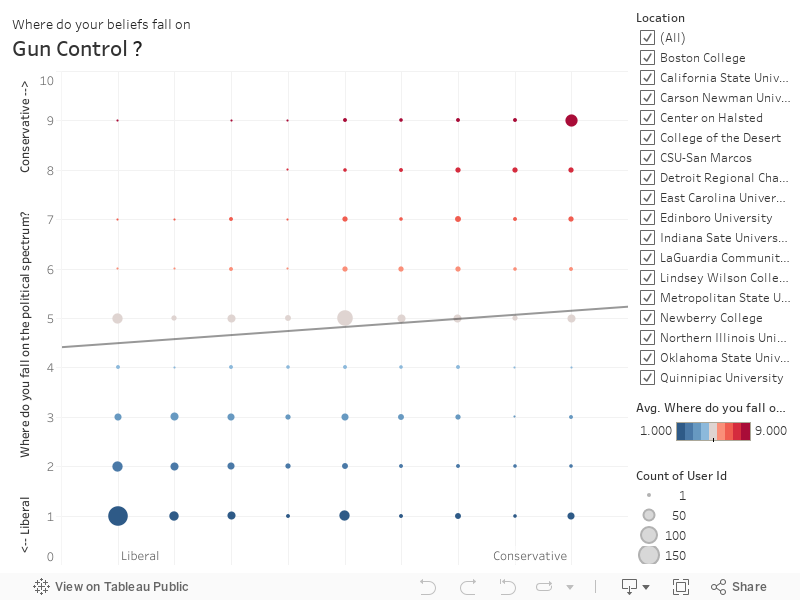
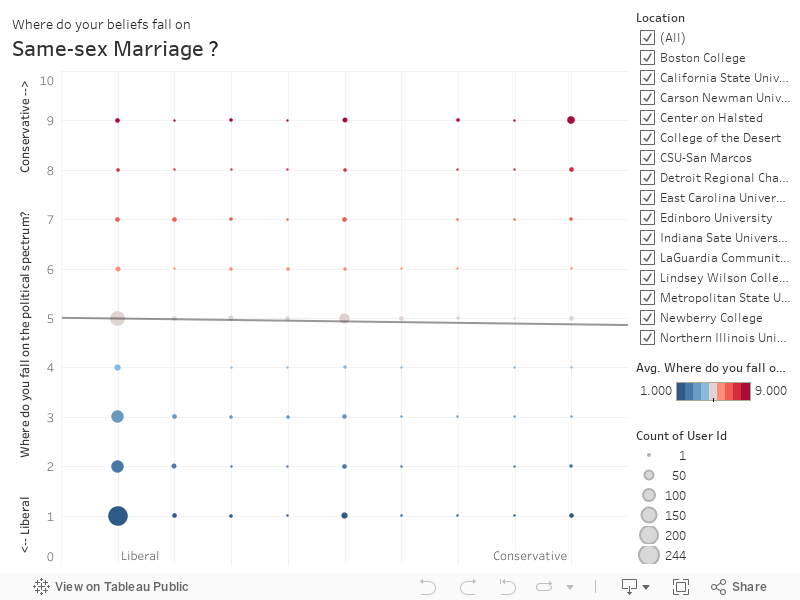
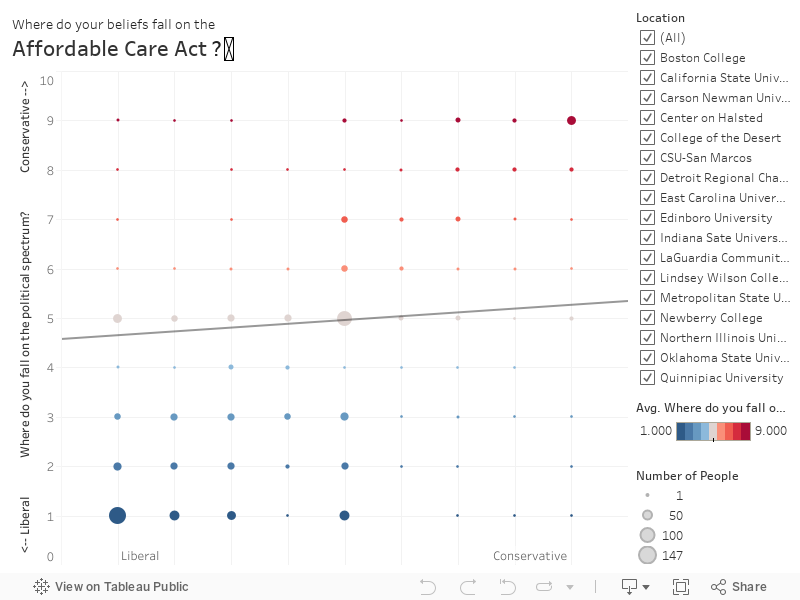
Issues versus Parties
Do people’s party affiliations accurately reflect their stance on the issues? We chose five hot-button topics to see where participants aligned: climate change, same-sex marriage, the Affordable Care Act, gun control and immigration. The charts in this section reveal respondents’ complex relationship to these issues and how divergent they can be from their party affiliations.
The grey line across each chart shows the statistical mean, where party identity is juxtaposed with respondents’ conservative/liberal stance on the issue. If people aligned fully with their partisan identities, the lines would run from the lower left corner (extremely liberal) diagonally to the upper right corner (extremely conservative). On the contrary, every line nears a zero-degree angle, with same-sex marriage showing an inverted trend. The overall takeaway from these charts reveals a more moderate approach to the issues than the extreme rhetoric of party politics. In many cases, people’s views on specific issues cross over the partisan divide.
Click tabs to see the corresponding graph.